Introduction to Orderbook Heatmaps
Fundamental Concepts
What is an Orderbook?
- Limit Orders: Orders placed at specific prices that wait to be filled
- Bids: Buy orders below the current price
- Asks: Sell orders above the current price
- Market Orders: Orders that execute immediately at the best available price
- The Orderbook: The complete collection of all limit orders waiting to be filled
How Heatmaps Work
A crypto orderbook heatmap displays:
- X-axis (horizontal): Time progression
- Y-axis (vertical): Price levels
- Color intensity: Volume/liquidity concentration at each price-time point
Brighter or more intense colors indicate higher concentration of orders, while darker or less intense colors show areas with fewer orders.
Why Heatmaps Matter for Traders
Heatmaps reveal critical information that price charts alone cannot show:
- Supply and demand imbalances: See where buying and selling pressure truly exists
- Support and resistance: Identify real liquidity levels, not just historical price points
- Market participant intentions: Recognize patterns that signal what larger players might be planning
- Potential price targets: Spot areas where price might be drawn to or repelled from
Reading the Heatmap: Key Features
Heatmap Blocks
Block Size & Resolution
The block size directly affects the heatmap's resolution:
- Smaller block sizes provide higher resolution, meaning you can see finer details of how orders are distributed across price levels. This allows you to detect subtle shifts in liquidity and identify more precise price points where significant buying or selling interest exists.
We currently offer two resolution options:
- SD (Standard Definition): Choose this option if you have limited working memory/RAM or experience performance issues. SD provides a balanced view while requiring fewer system resources.
- HD (High Definition): This option displays liquidity changes in a more granular fashion, revealing micro-structures in order flow that might be missed at lower resolutions.
Heatmap Magnifier
Heatmap Units
Viewing in USD provides several advantages:
- Easier comparison across different assets with varying price ranges.
- More intuitive understanding of market size and importance for traders accustomed to thinking in dollar terms.
- Clearer perspective on the actual monetary impact of liquidity clusters.
- Simplified risk management when calculating position sizing relative to available liquidity.
Heatmap Filtering & Intensity Controls
Visibility & Intensity Sliders
Two main sliders control how the heatmap displays liquidity:
- Threshold (left slider): Sets the minimum size of orders to display. Orders smaller than this value are filtered out, reducing noise and letting you focus on significant liquidity.
- Ceiling (right slider): Determines the value at which color intensity reaches its maximum. All orders above this value appear with the same intensity, creating better visual contrast for the liquidity that matters most.
For most trading situations, adjusting these two sliders provides adequate filtering and highlighting of important liquidity zones.
Quickly switch between Presets to adjust the balance between signal and noise on your heatmap.
- High sensitivity reveals smaller order activity, useful for spotting early signals or subtle shifts.
- Medium sensitivity offers a balanced view, filtering minor noise while preserving key liquidity areas.
- Low sensitivity shows only significant liquidity levels, ideal for clearly identifying strong support or resistance.
Toggle easily to match your trading style, market volatility, or analytical goals.
Advanced Range Controls
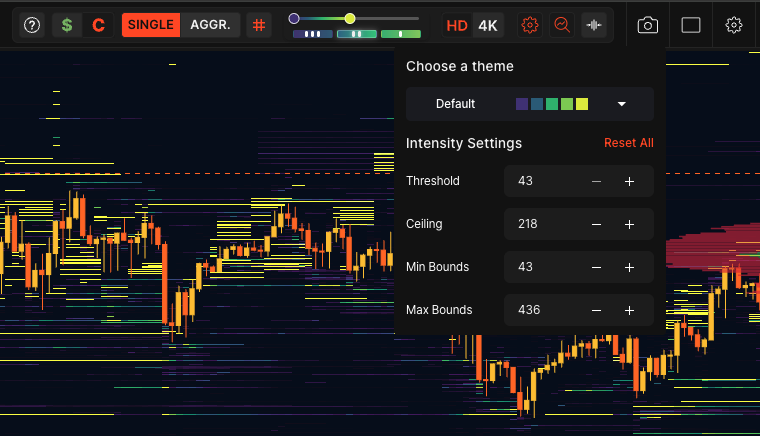
- Min Bounds - Lower: Sets how low the Threshold slider can go
- Max Bounds - Upper: Sets how high the Ceiling slider can go
These controls are particularly useful when:
- Trading assets with very low unit prices but massive volumes
- Studying precise algorithmic limit orders that cluster tightly around current price
- Needing to visualize extremely large or small liquidity values
Access these advanced controls by clicking the settings icon next to the sliders.
Alternative Visualization Tools
Orderbook Depth Indicator
Delta Bar Indicator
Why Use These Tools
- Reduced complexity for traders who find full heatmaps overwhelming
- Lower performance requirements on less powerful devices
- Cleaner chart view while still capturing essential orderbook dynamics
- Faster pattern recognition by focusing only on critical imbalance data
- Complementary analysis when used alongside heatmaps
- Quicker learning curve for traders new to orderbook analysis
Many experienced traders use both approaches—heatmaps for detailed analysis and these indicators for quick reference.
Heatmap Themes
Customize the look of your heatmap in a few simple taps.
Select a main theme to change everything, or choose Heatmap Colors to adjust just the heatmap.
Mix and match the charting theme with the heatmap theme to provide the best contrast, helping you easily identify liquidity shifts and clusters at a glance.
Our themes aren't just beautiful—they're purposeful. Single and dual-color themes are precision-designed to reveal subtle patterns in order data that might otherwise remain hidden, helping you make more informed decisions.
Putting It All Together
- Open interest changes
- Volume profiles
- Key support/resistance levels
This multi-dimensional approach creates stronger confluence and higher probability setups than any single indicator alone.
Remember that heatmaps reveal intentions, not guarantees. They show where liquidity exists and how it's changing, giving you insight into potential price movements before they occur.
As you gain experience, you'll develop an intuitive understanding of how orderbook patterns correspond to price movements. This orderbook intuition will become one of your most valuable trading skills, helping you stay one step ahead of traders relying solely on price action.
The most successful traders don't just react to the market—they anticipate it. With heatmap analysis in your toolkit, you now have the ability to see what others cannot.