Full Footprint Launch — Order Flow at Maximum Resolution
What Are Footprint Charts?
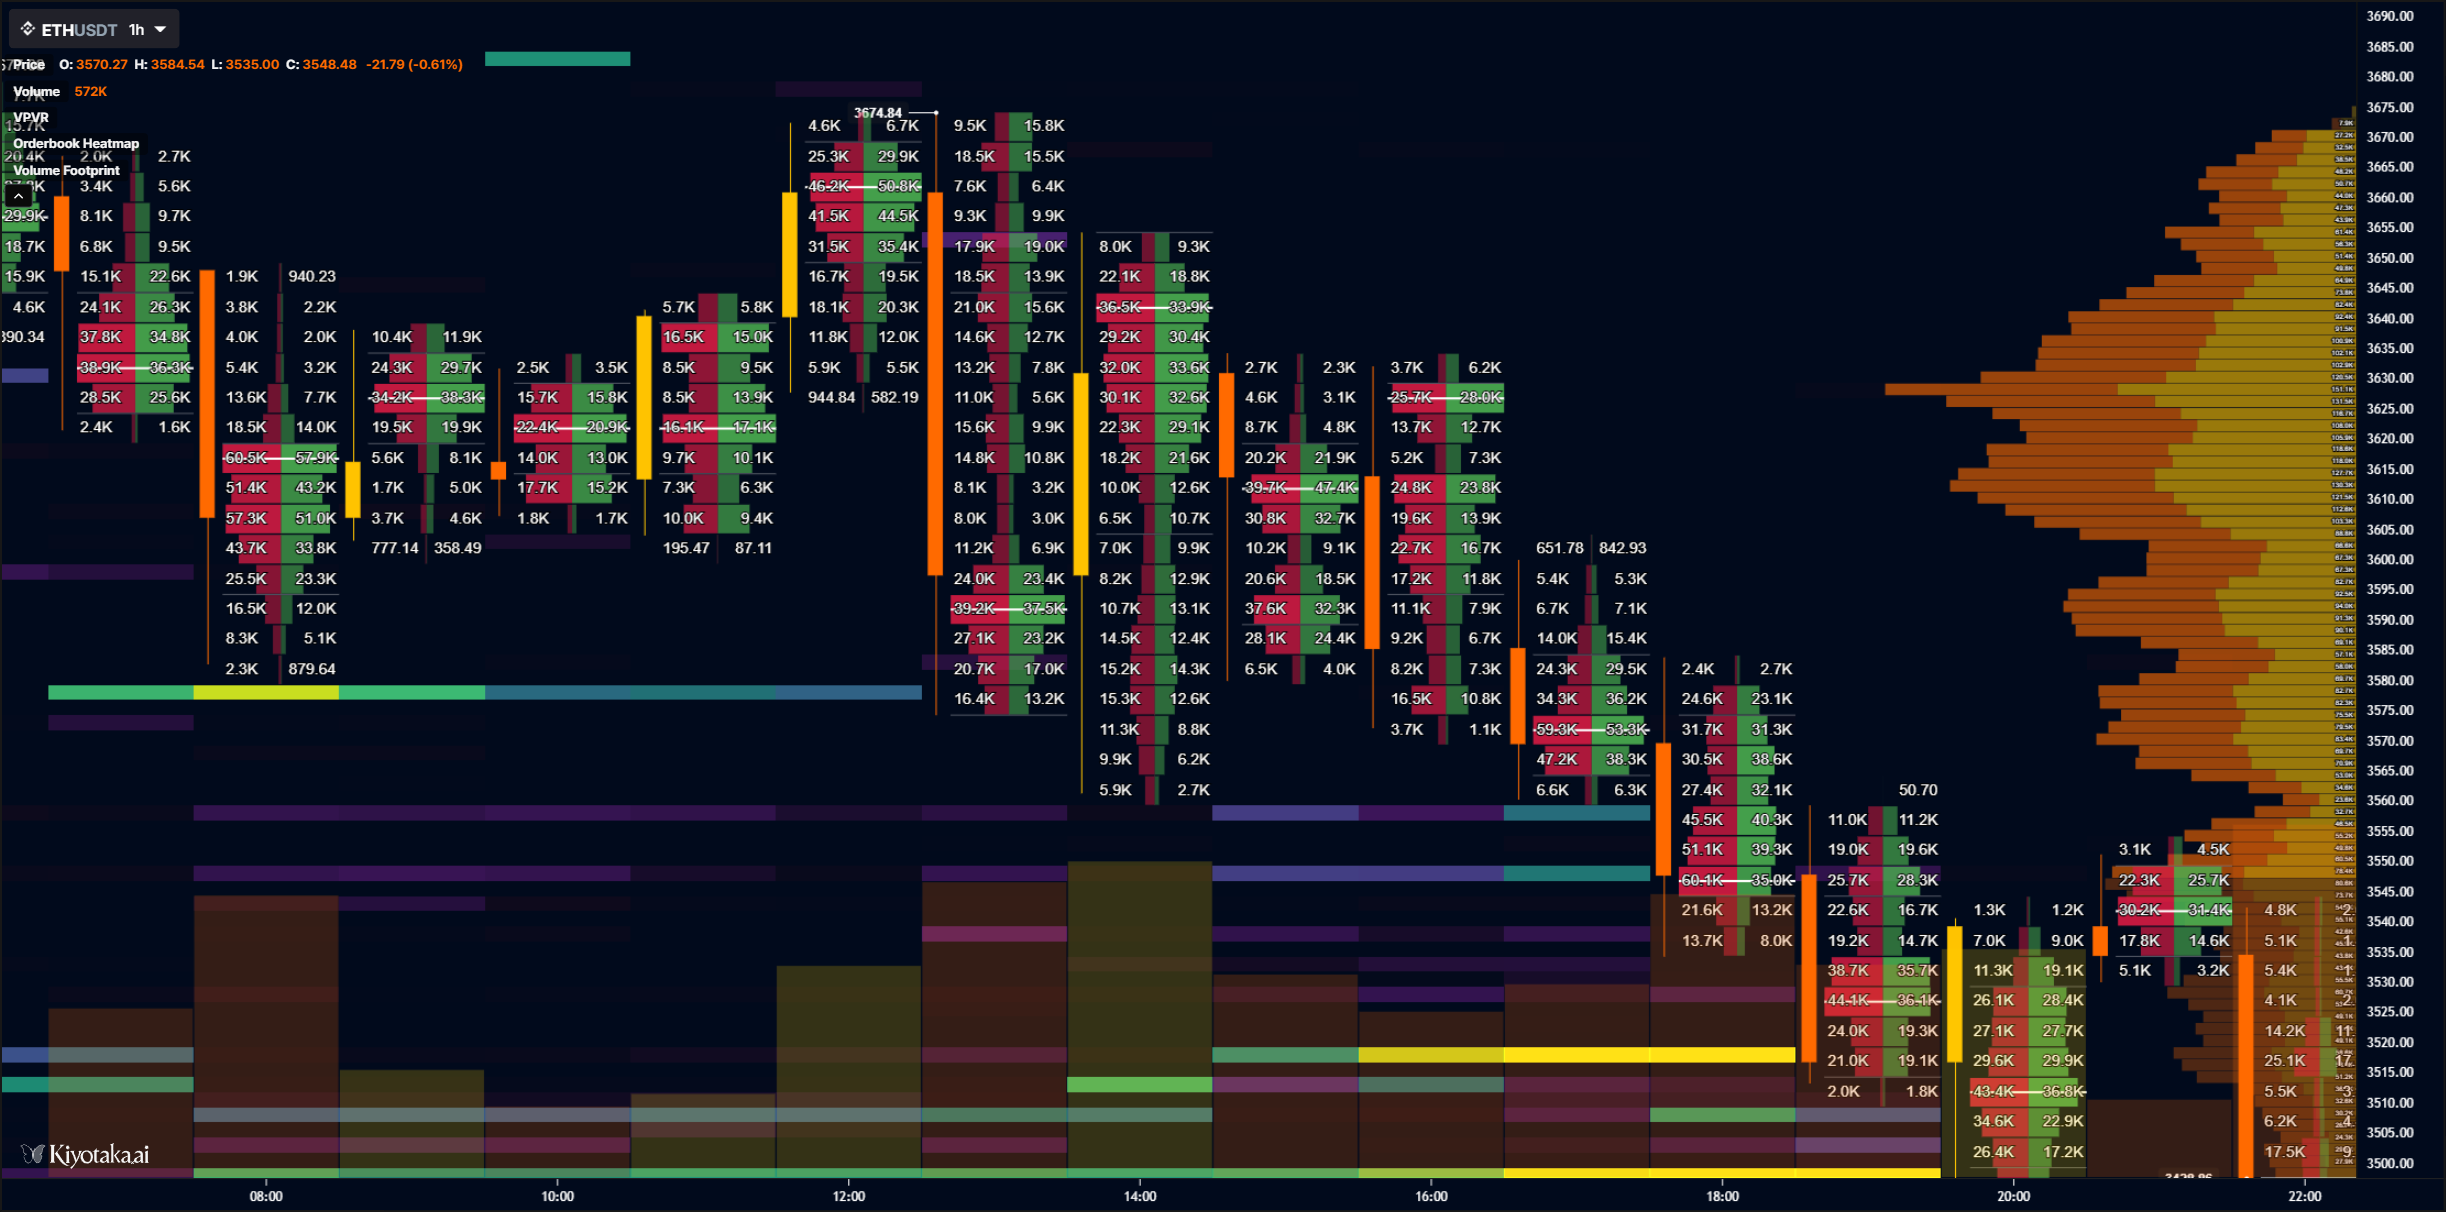
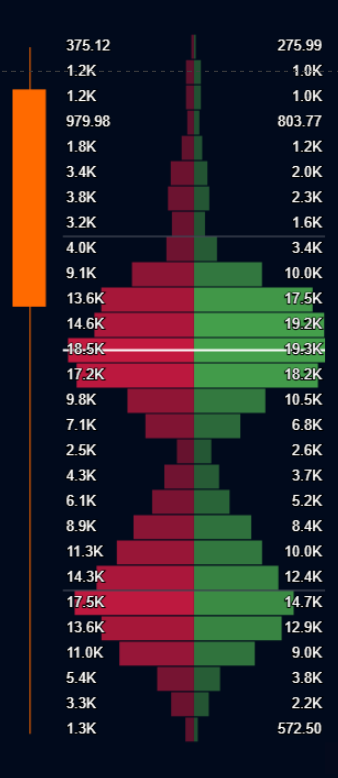
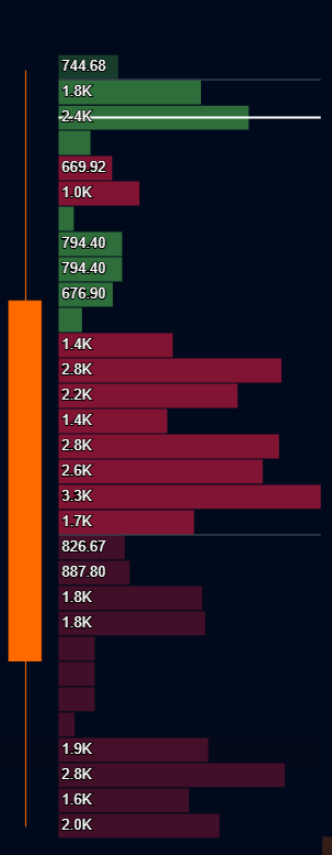
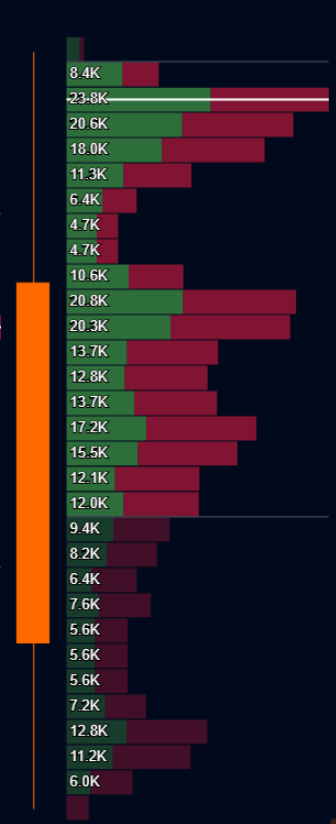
Footprint charts show volume traded at each price level within a candle, split between aggressive buyers and sellers. While candlesticks show you price movement, footprints reveal the actual order flow driving that movement - letting you see absorption, initiative activity, and where real size is trading.
Three Visualization Modes
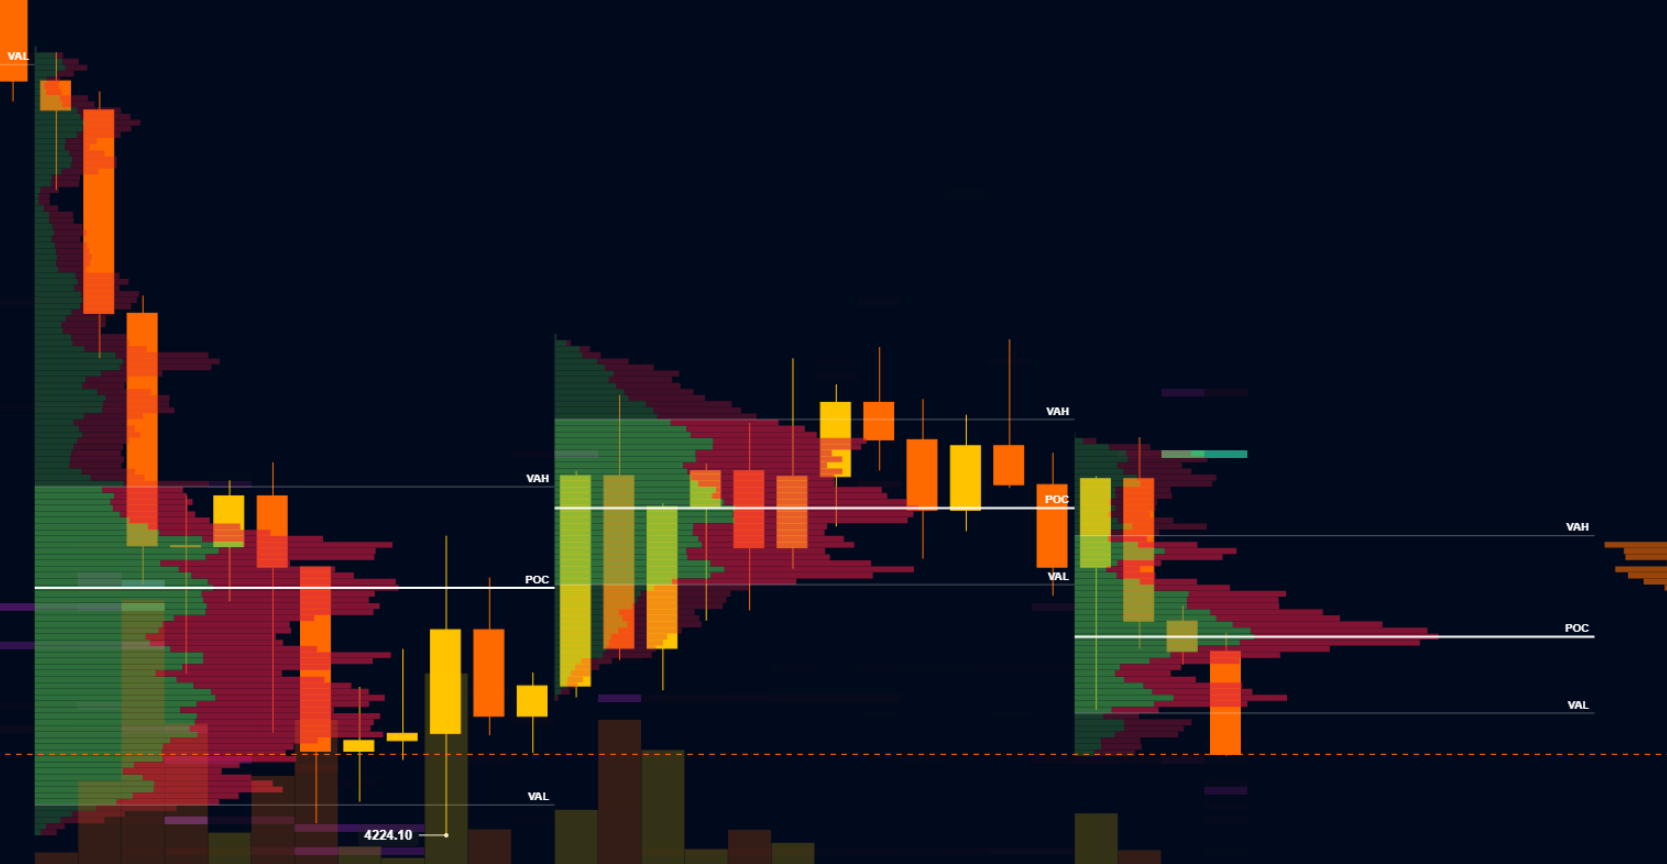
POC, VAH, VAL Levels
Every footprint automatically calculates Point of Control (price with most volume), Value Area High, and Value Area Low (containing 70% of volume). They're statistically significant levels based on actual traded volume that act as magnets and breakout triggers.
Built-in Session Profiles
One-click session profiles for US, UK, and APAC markets. Compare where volume actually trades across different sessions - that Asian session high might have zero US institutional volume behind it. That London support might get completely ignored by New York traders.
Full customization available for session times, value area percentages, color schemes, and volume filters.
Footprints + Order Book Heatmaps
The real edge comes from combining footprints with our order book heatmaps. Heatmaps show where passive liquidity sits in the book. Footprints show what happens when price gets there.
Is that sell wall actually defending? Are those buy orders providing real support or pulling when tested? You're watching the full picture - intention meets execution.
1-Second Granularity
The biggest upgrade: footprints now work down to 1-second candles. Previously, we only supported multi-candle footprints (similar to VPSV), grouping multiple candles into one footprint interval. Now you get tick-by-tick order flow visibility.
This matters because significant order flow events - iceberg fills, book sweeps, absorption - often happen and resolve in seconds. You're no longer blind to the micro-structure that actually moves price.
VPSV Note
For those familiar with VPSV (Volume Profile Session Volume), it's essentially a footprint with multiple candles grouped into the same interval. Our footprints give you that same profile view but with granularity down to individual candles and now even 1-second intervals.