Real-Time Liquidation Heatmaps for Hyperliquid
Tracking Positions and Anticipating Volatility
Imagine having the ability to monitor high-profile traders like James Wynn, tracking their positions right up to the point of liquidation. Our heatmaps make this possible, providing early warnings of impending volatility. By pinpointing exactly where big traders—often referred to as "whales"—are at risk of liquidation as prices fluctuate, you can identify overleveraged positions and liquidity clusters that might trigger cascading effects.
These heatmaps deliver the full market picture, enabling you to anticipate what's coming before it impacts the broader ecosystem.
Why Liquidation Heatmaps Shine on Hyperliquid
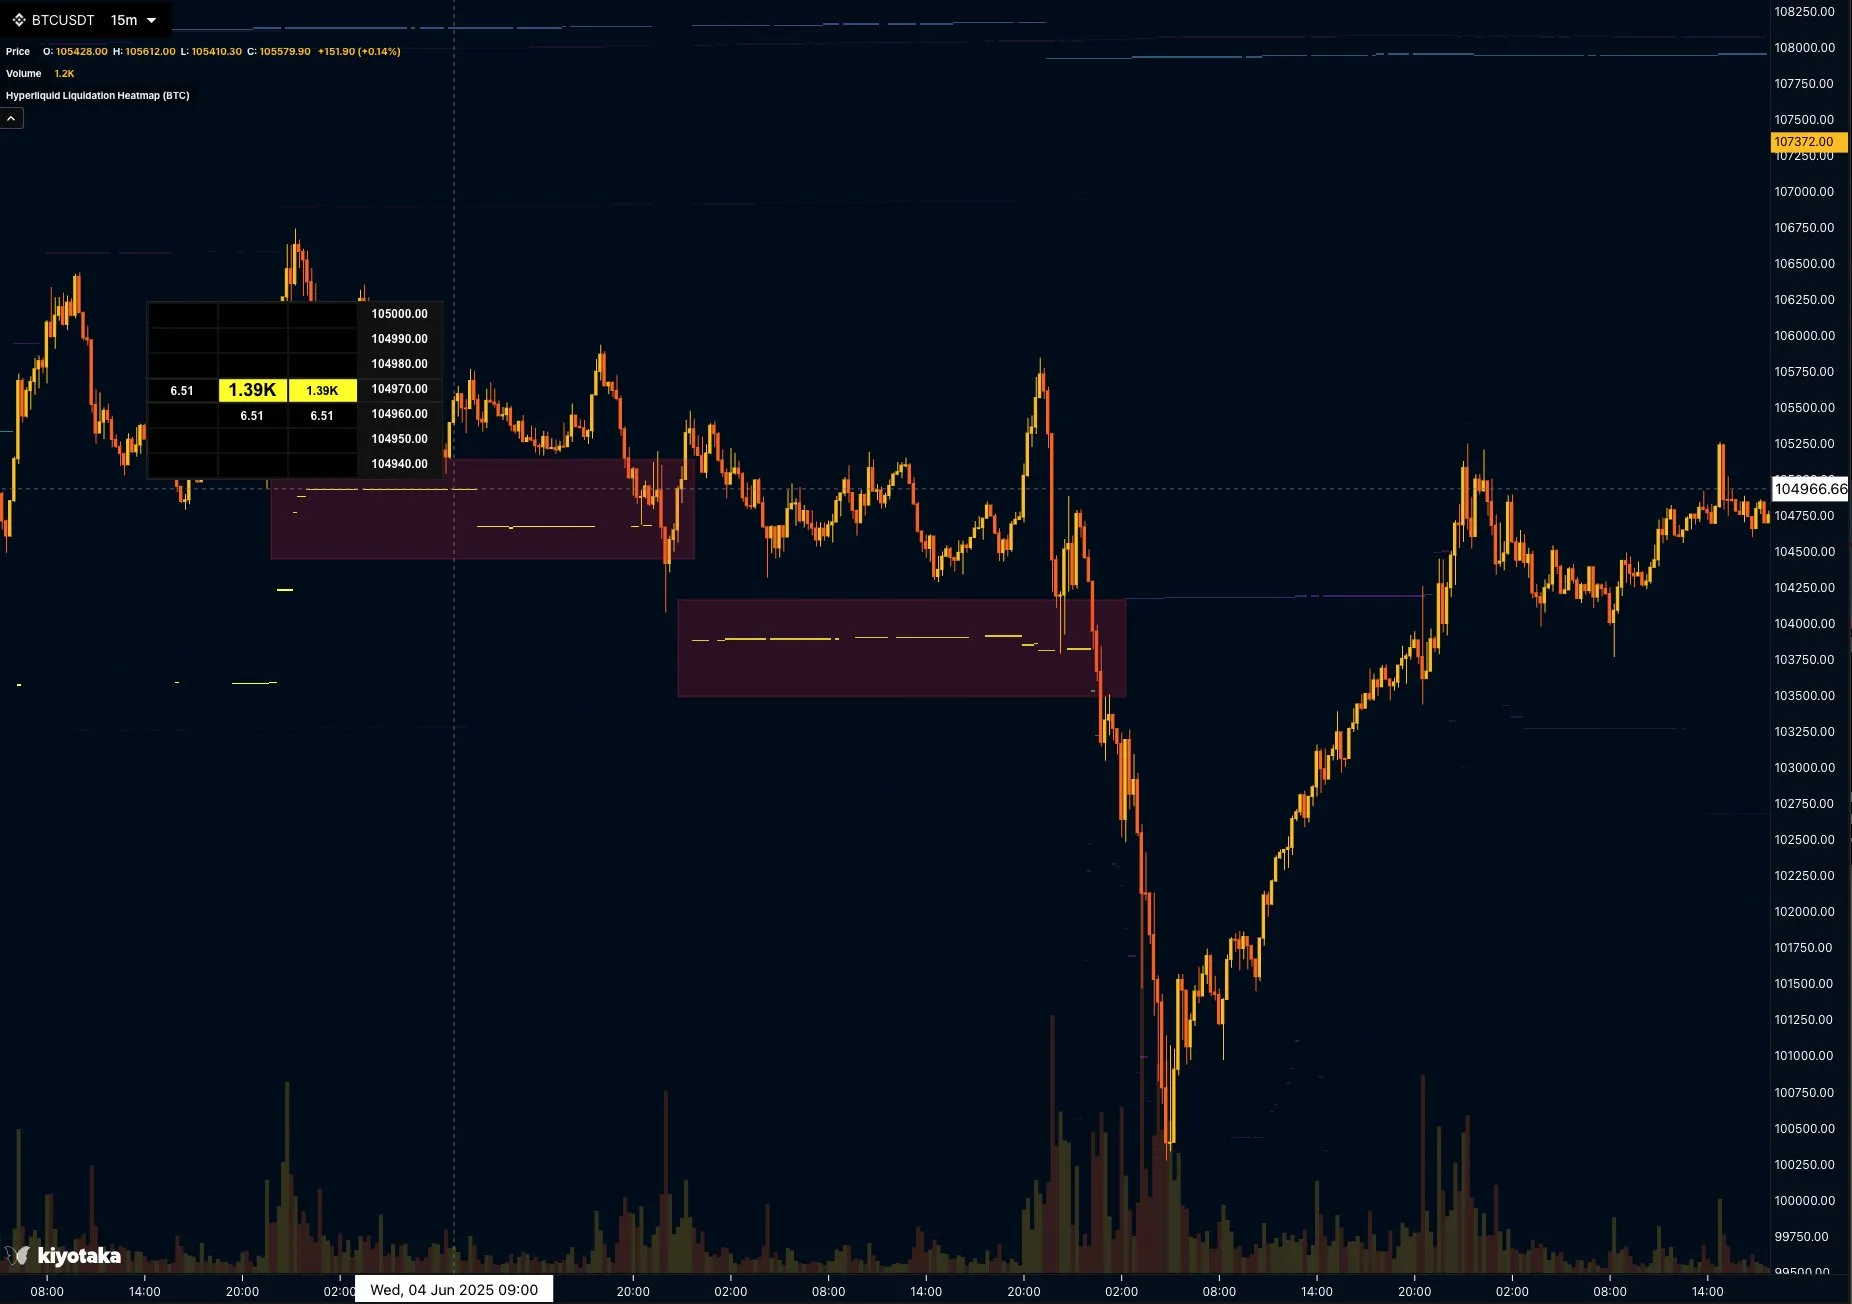
Hyperliquid's on-chain, decentralized design sets it apart from traditional exchanges, making it an ideal platform for advanced analytics like liquidation heatmaps. Unlike centralized venues where data can be opaque, Hyperliquid records every position transparently on the blockchain. This transparency allows our heatmaps to aggregate and display actual liquidation thresholds based on real-time leverage, collateral, and price data—turning complex on-chain information into intuitive visual representations.
The intuition behind these heatmaps is rooted in understanding market dynamics: Liquidations occur when a trader's position falls below maintenance margin requirements, forcing automatic closures that can inject sudden selling (or buying) pressure into the market. On Hyperliquid, where trading volumes in perpetuals like BTC/USD or ETH/USD can surge rapidly, clusters of liquidation levels often act as magnets for price action. For instance, a dense cluster of long positions at a certain price point might signal a potential downside cascade if prices dip, creating opportunities for short sellers or risk-averse traders to adjust their strategies.
This tool is particularly powerful on Hyperliquid due to its focus on high-leverage trading in a permissionless environment. Traders can operate with up to 50x leverage on select pairs, heightening the risk of liquidations during volatile periods—such as those driven by macroeconomic news or crypto-specific events. By visualizing these risks, our heatmaps help demystify how individual positions contribute to broader market behavior, fostering more informed decision-making.
Practical Use Cases for Traders
Liquidation heatmaps aren't just about observation; they're a strategic asset with diverse applications:
- Risk Management: Assess your own positions relative to liquidation clusters. If you're holding a long position and notice a wall of shorts liquidating nearby, you might tighten stops or reduce leverage to avoid getting caught in a squeeze.
- Volatility Forecasting: Spot areas where liquidations could cascade, such as during a flash crash. For example, if heatmaps reveal heavy clustering around $60,000 for BTC on Hyperliquid, traders can prepare for amplified swings as prices approach that level, potentially entering hedging trades.
- Whale Watching: Identify overleveraged large holders whose liquidations could move the market. Tracking figures like James Wynn provides real-world context, helping retail traders align with or against institutional flows.
- Opportunity Identification: Use clusters to find entry points. A sparse liquidation zone might indicate smoother price paths, ideal for trend-following strategies, while dense zones could signal reversal setups.
- Portfolio Optimization: In a multi-asset portfolio, compare Hyperliquid's liquidation landscape with other chains or exchanges to allocate capital where risks are lower or rewards higher.
By integrating these use cases, our heatmaps transform raw data into actionable intelligence, helping traders navigate Hyperliquid's high-stakes environment with greater confidence.
What Sets Our Data Apart 🏆
While many liquidation heatmaps on the market depend on approximate models and assumptions, ours stands out for its precision. Competitors often lack direct access to real positions, leading to unreliable estimates that can mislead users. In contrast, Kiyotaka pulls data straight from Hyperliquid's verifiable on-chain records, ensuring every liquidation level displayed is accurate and up-to-date.
This direct sourcing means you're basing decisions on genuine market realities, not hypotheticals—giving you a reliable edge in timing trades, managing risks, and capitalizing on inefficiencies.
More Heatmap & Integration Goodies 👨🍳
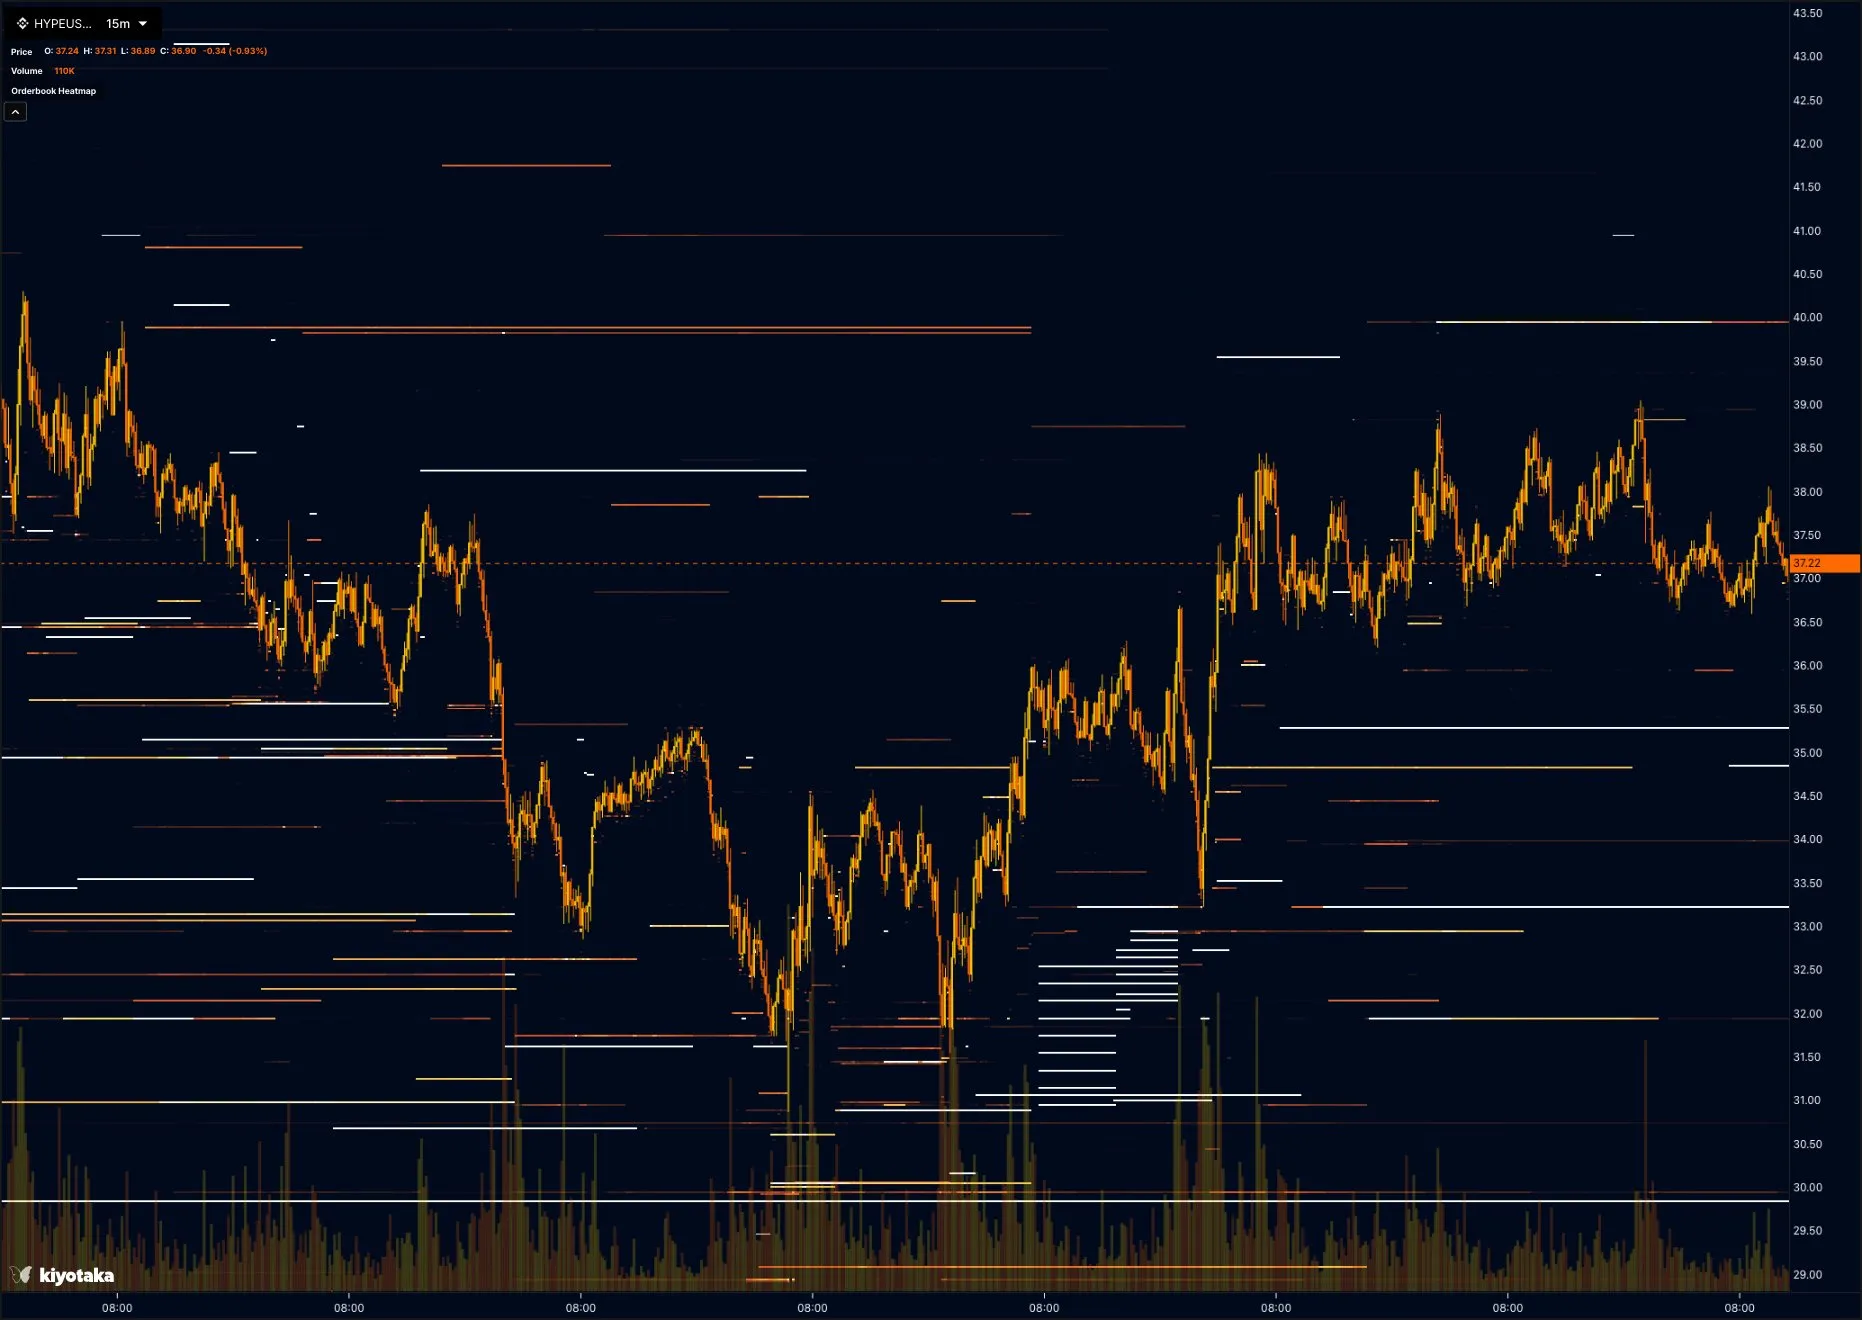
In addition to liquidation heatmaps, we're rolling out order book heatmap support for Hyperliquid, along with integrated HYPE order books from Binance. These enhancements allow for real-time liquidity comparisons across venues, making it easier to spot arbitrage opportunities. For instance, discrepancies in bid-ask spreads between Hyperliquid's decentralized setup and Binance's centralized liquidity could reveal profitable cross-exchange trades.
Whether you're arbitraging price differences or analyzing depth to gauge market sentiment, these tools provide a unified view that bridges decentralized and traditional finance.
Looking Forward
We invite you to explore these new features on Hyperliquid today and share your feedback—your insights drive our future developments.
Stay informed, trade smarter.